The record global warming streak of 2014-2016: a snowball's chance in hell that this was natural
Author Vishay SinghPosted on Categories Discover Magazine
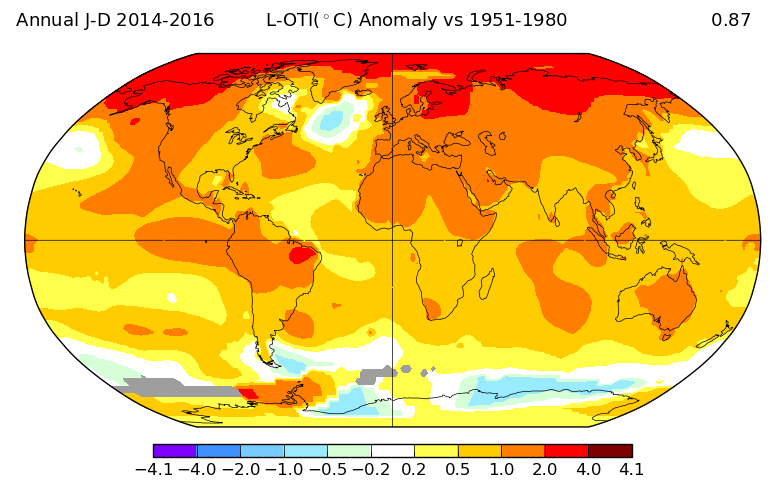
This map from NASA shows the pattern of unusual, record-setting warmth between 2014 and 2016, compared to the long-term average. (Source: NASA GISS)
Okay, I admit that I don’t really know the odds of a snowball surviving in hell. But a new study suggests that’s an apt way of describing the chances that 2014 through 2016’s record-setting heat was natural.
The study finds that there was a 1 in 3,000 chance that natural causes alone were to blame for the sequence of three consecutive global warming records set in 2014, 2015 and 2016.

The long-term trend in global temperature. I’ve circled the record-setting years of 2014-2016.
When humankind’s influence on the climate is taken into account, the odds rise dramatically. In that case there is a 1 to 3 percent chance of such a record-breaking streak occurring, according to the study, published yesterday in the Journal Geophysical Research Letters.
While those chances are still quite small, 1 in a hundred is clearly a hell of a lot more likely than 1 in 3,000. Also consider this: When a longer period of time is considered, the picture changes quite dramatically. The odds of the streak occurring at some point between the year 2000 and 2016 are 20 to 50 percent with human-caused warming accounted for, according to the study, led by Michael Mann of Pennsylvania State University. Without anthropogenic warming? Just 0.7 percent.
If there were any doubts that 2016 was indeed the warmest on record, the annual State of the Climate Report, also published yesterday, should erase them.
Prepared by nearly 500 scientists from more than 60 nations, and based on tens of thousands of measurements from multiple, independent datasets, the report confirmed that 2016 did indeed surpass 2015 as the warmest year in 137 years of record keeping. And 2015, you might recall, broke the previous record set just the year prior in 2014, thus making for that streak of three record-setting years in a row.
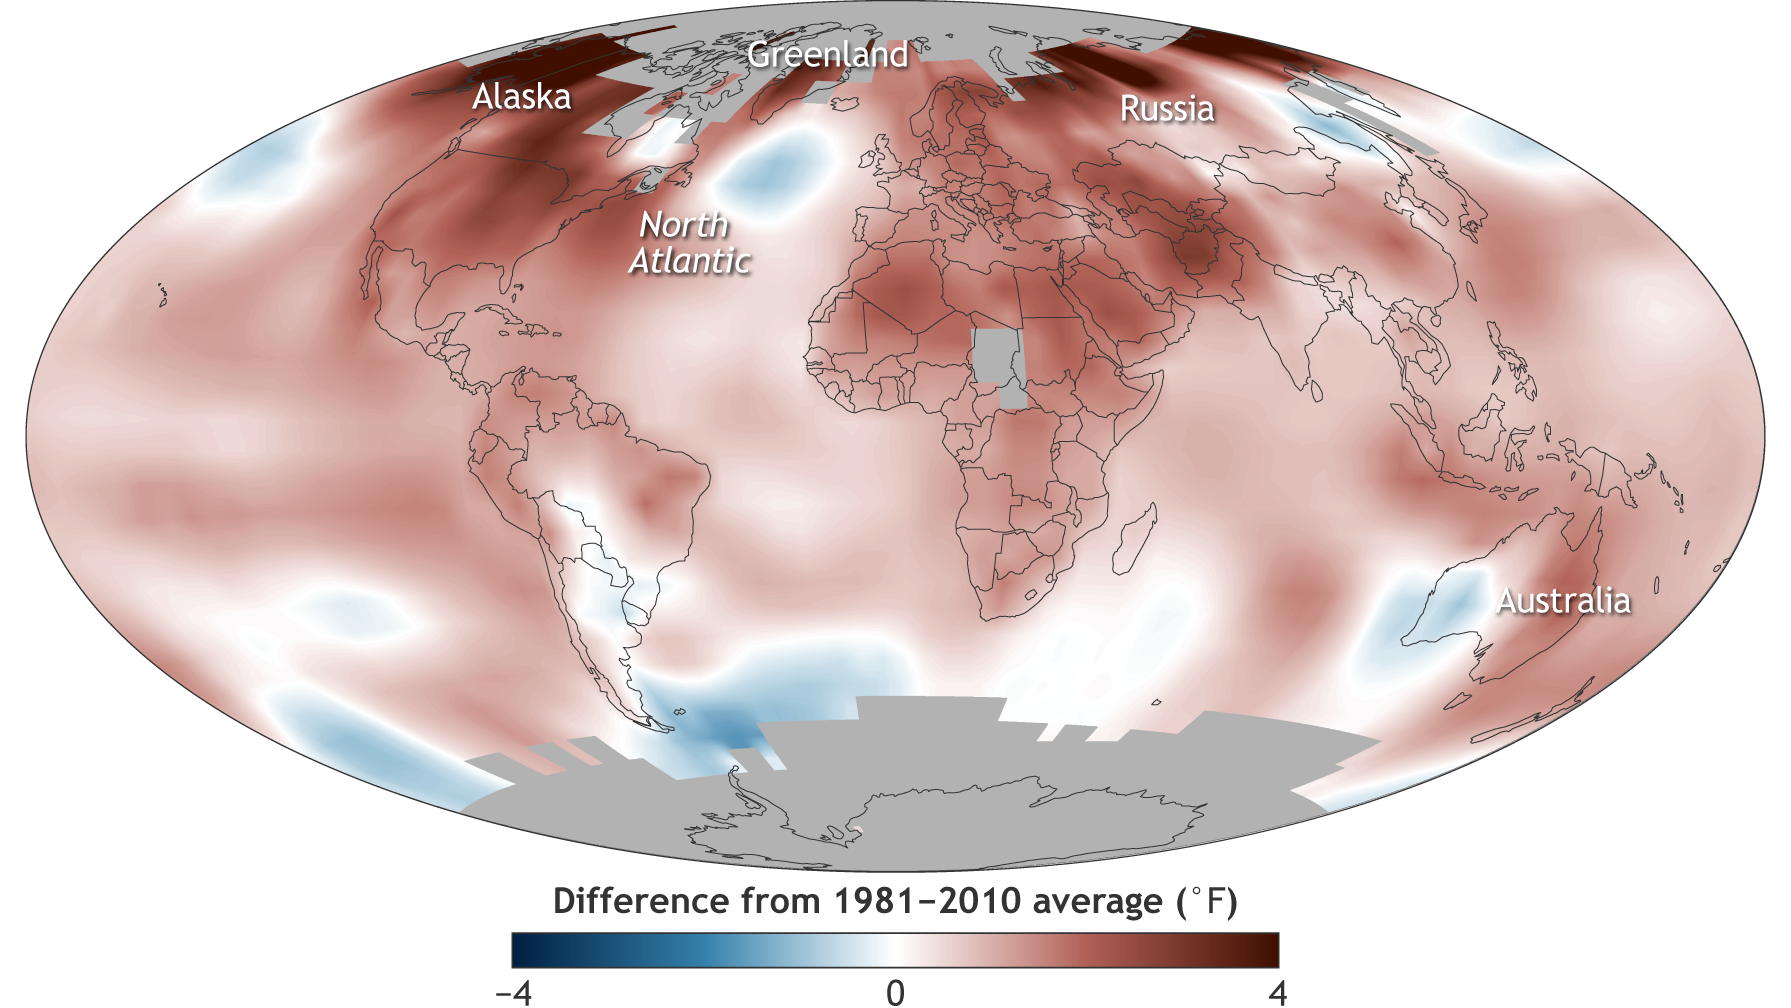
The pattern of unusual warmth in 2016 is revealed in the map, which shows how temperatures varied from the long-term average. (Source: NOAA Climate.gov)
The long-term trend of human-caused warming combined with an extremely strong El Niño event early in the year to produce 2016’s record-setting warmth, according to the report, published as a supplement to the Bulletin of the American Meteorological Society. Also, as a summary from NOAA puts it:
The report found that the major indicators of climate change continued to reflect trends consistent with a warming planet. Several markers such as land and ocean temperatures, sea level, and greenhouse gas concentrations in the atmosphere broke records set just one year prior.
Here’s a visual look at some of the markers mentioned by NOAA:
Greenhouse gases
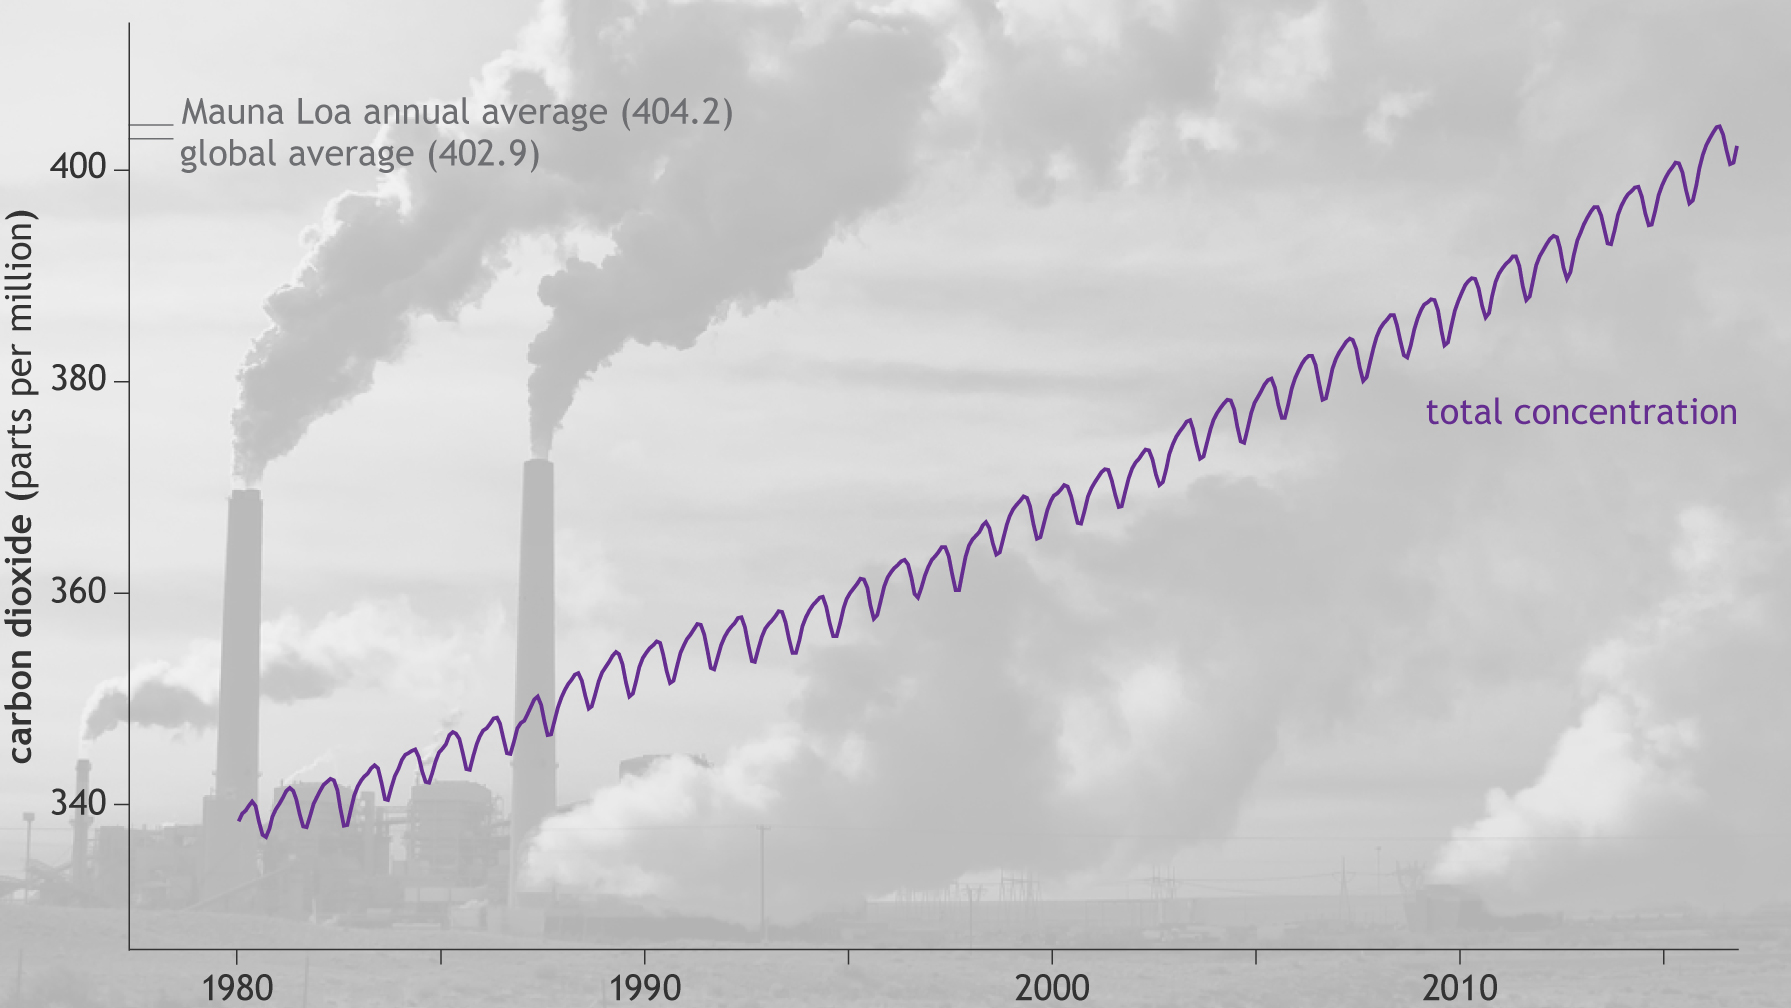
The small squiggles in this graph charting the trend in the atmosphere’s concentration of carbon dioxide are the result of a natural seasonal cycle. Human emissions of CO2 from fossil-fuel burning and other activities is the cause of the long-term rising trend. (Source: NOAA Climate.gov, adapted from State of the Climate in 2016)
According to NOAA’s summary:
Major greenhouse gas concentrations, including carbon dioxide (CO2), methane, and nitrous oxide, rose to new record high values during 2016.
The global average concentration of CO2 in the atmosphere for the year was 402.9 parts per million. This is higher than it has been in at least 800,000 years. But the even bigger news here, I thought, was that the increase in CO2 over 2015’s average value: 3.5 parts per million. This is the largest annual increase observed in the 58-year record.
We’re not yet on a good path for mitigating climate change.
Sea surface temperatures
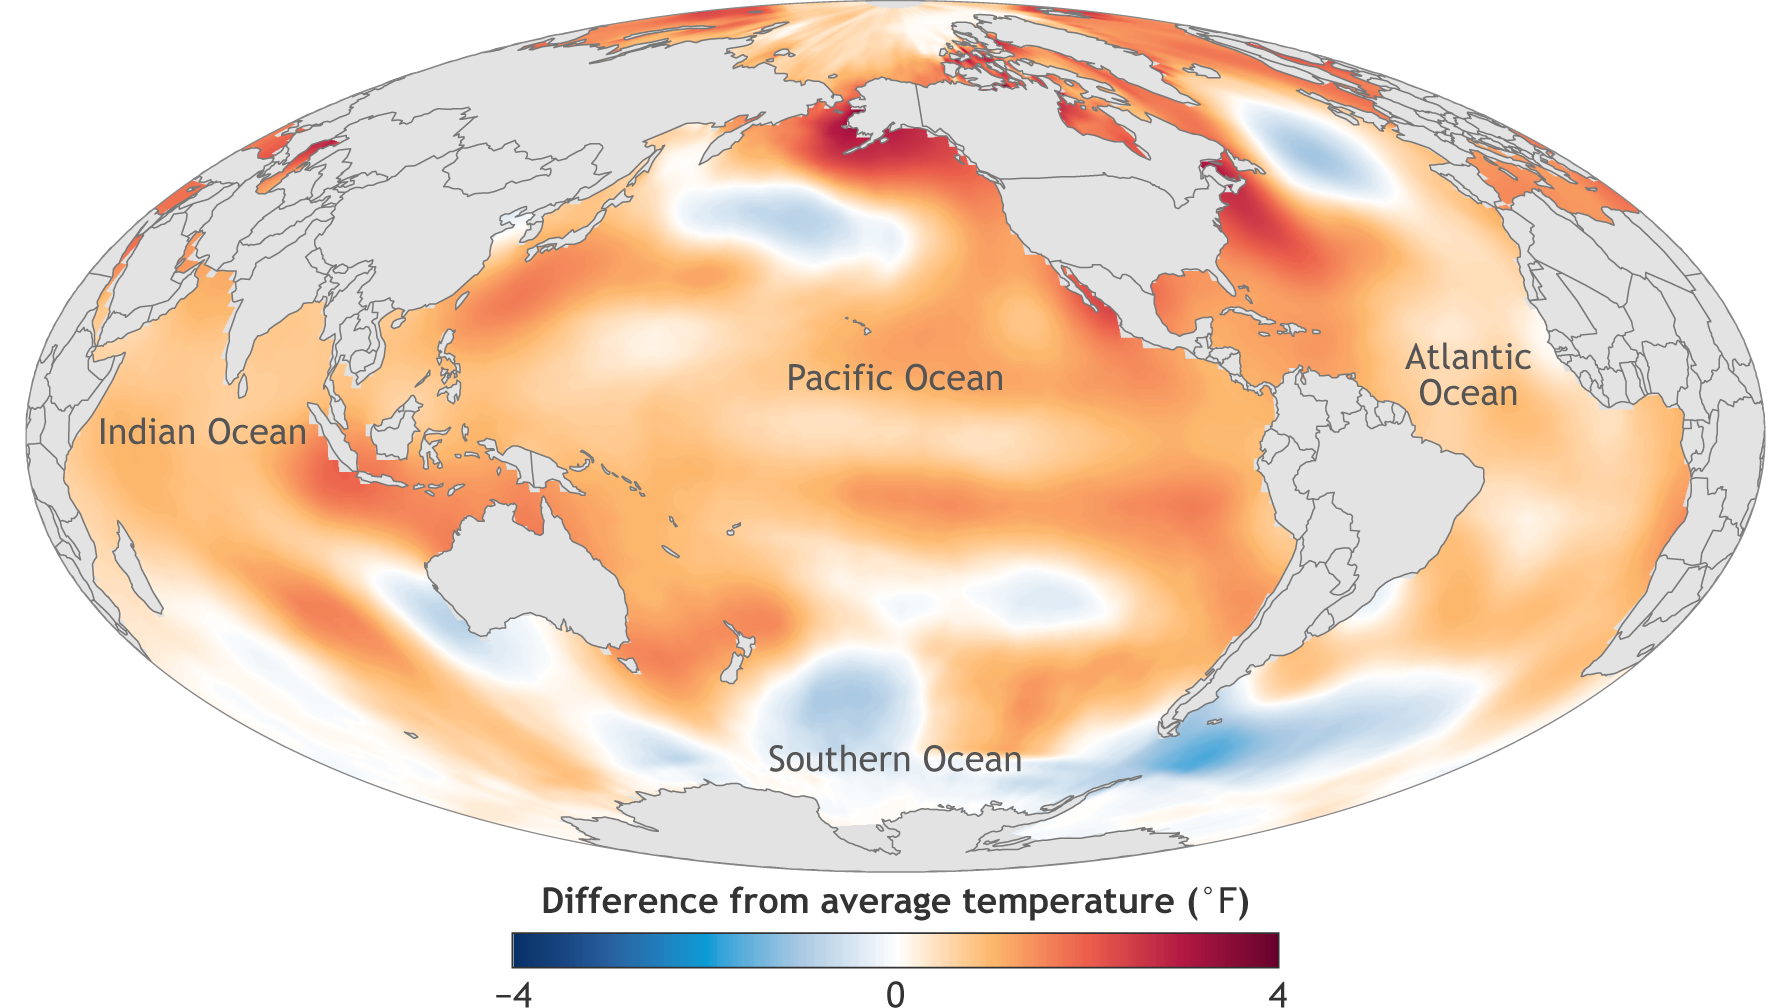
The global average temperature of the sea surfaces was highest on record in 2016. Moreover the rate of warming between 2000 and 2016 was much higher than the longer-term warming trend. From NOAA:
The more recent global sea surface temperature trend for the 21st century-to-date (2000–2016) of +2.92°F (1.62°C) per century is much higher than the longer term (1950–2016) warming trend of +1.8°F (1.0°C) per century.
Sea level rise
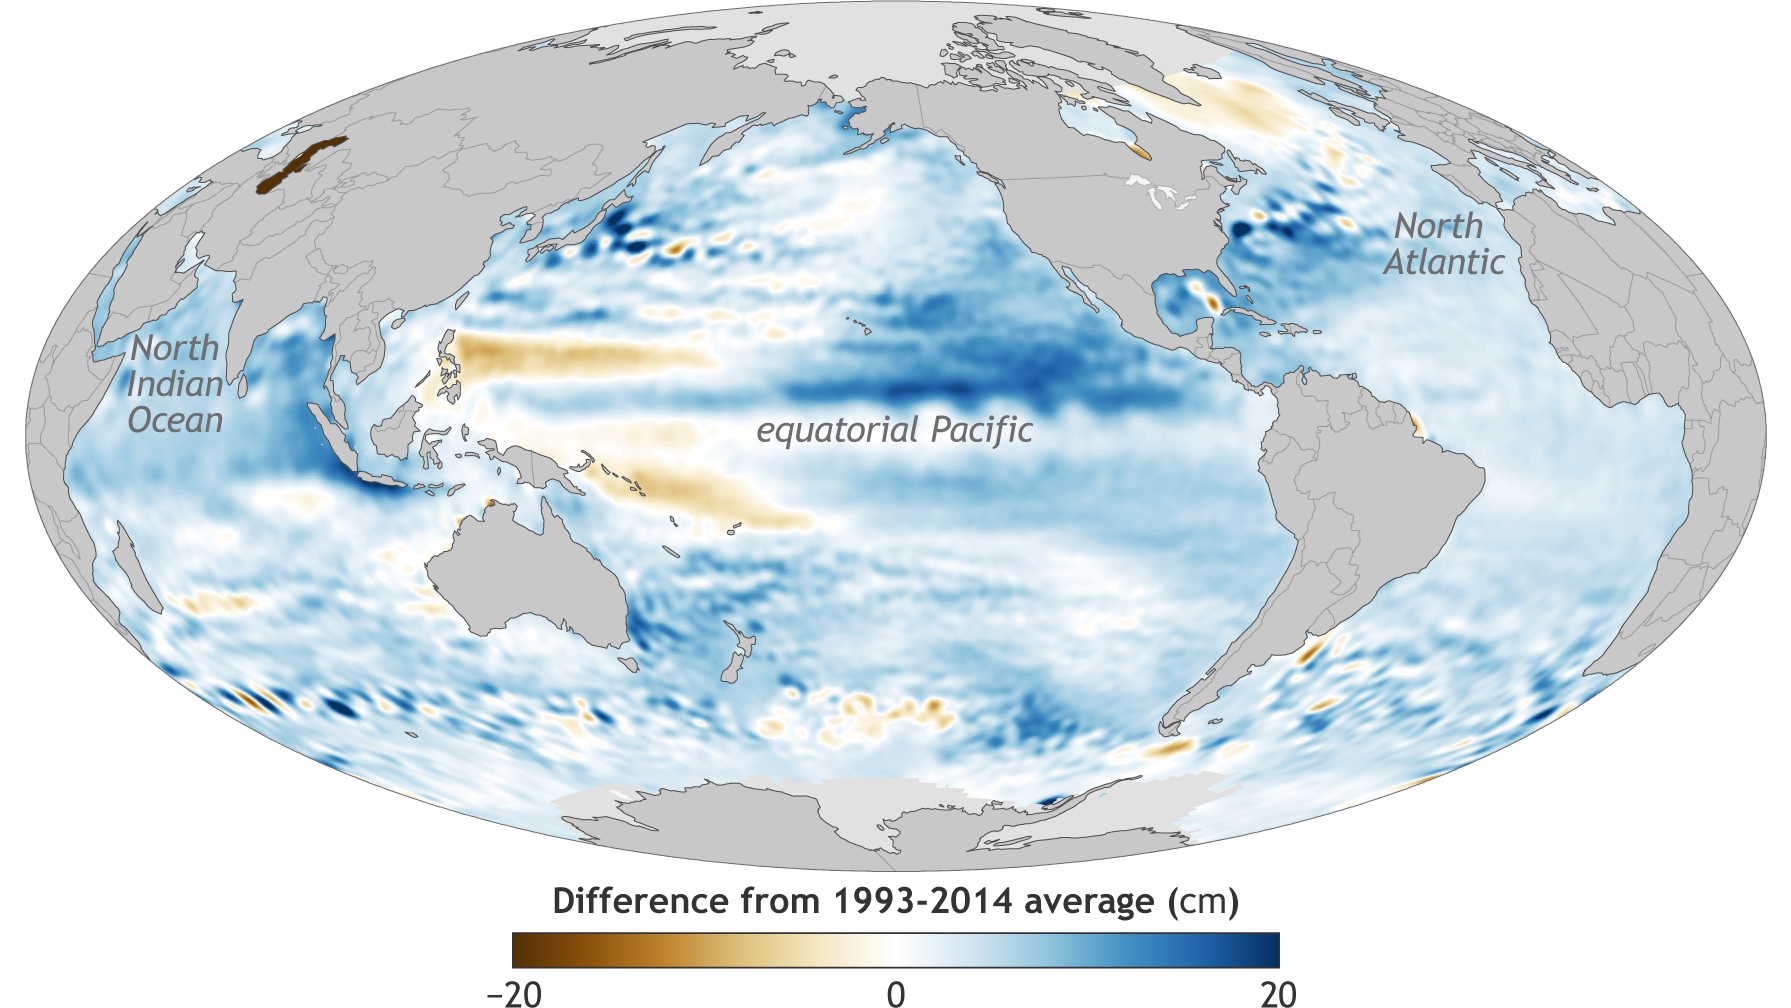
The pattern of sea level around the globe in 2016, compared to the long-term average. (Source: NOAA Climate.gov)
Just as atmospheric and sea-surface temperatures set records, so did sea level in 2016, according to the State of the Climate report. Sea level, according to NOAA’s summary:
. . . was about 3.25 inches (82 mm) higher than the 1993 average, the year that marks the beginning of the satellite altimeter record. This also marks the sixth consecutive year global sea level has increased compared to the previous year. Over the past two decades, sea level has increased at an average rate of about 0.13 inch (3.4 mm) per year, with the highest rates of increase in the western Pacific and Indian Oceans.
Extreme Precipitation and Drought
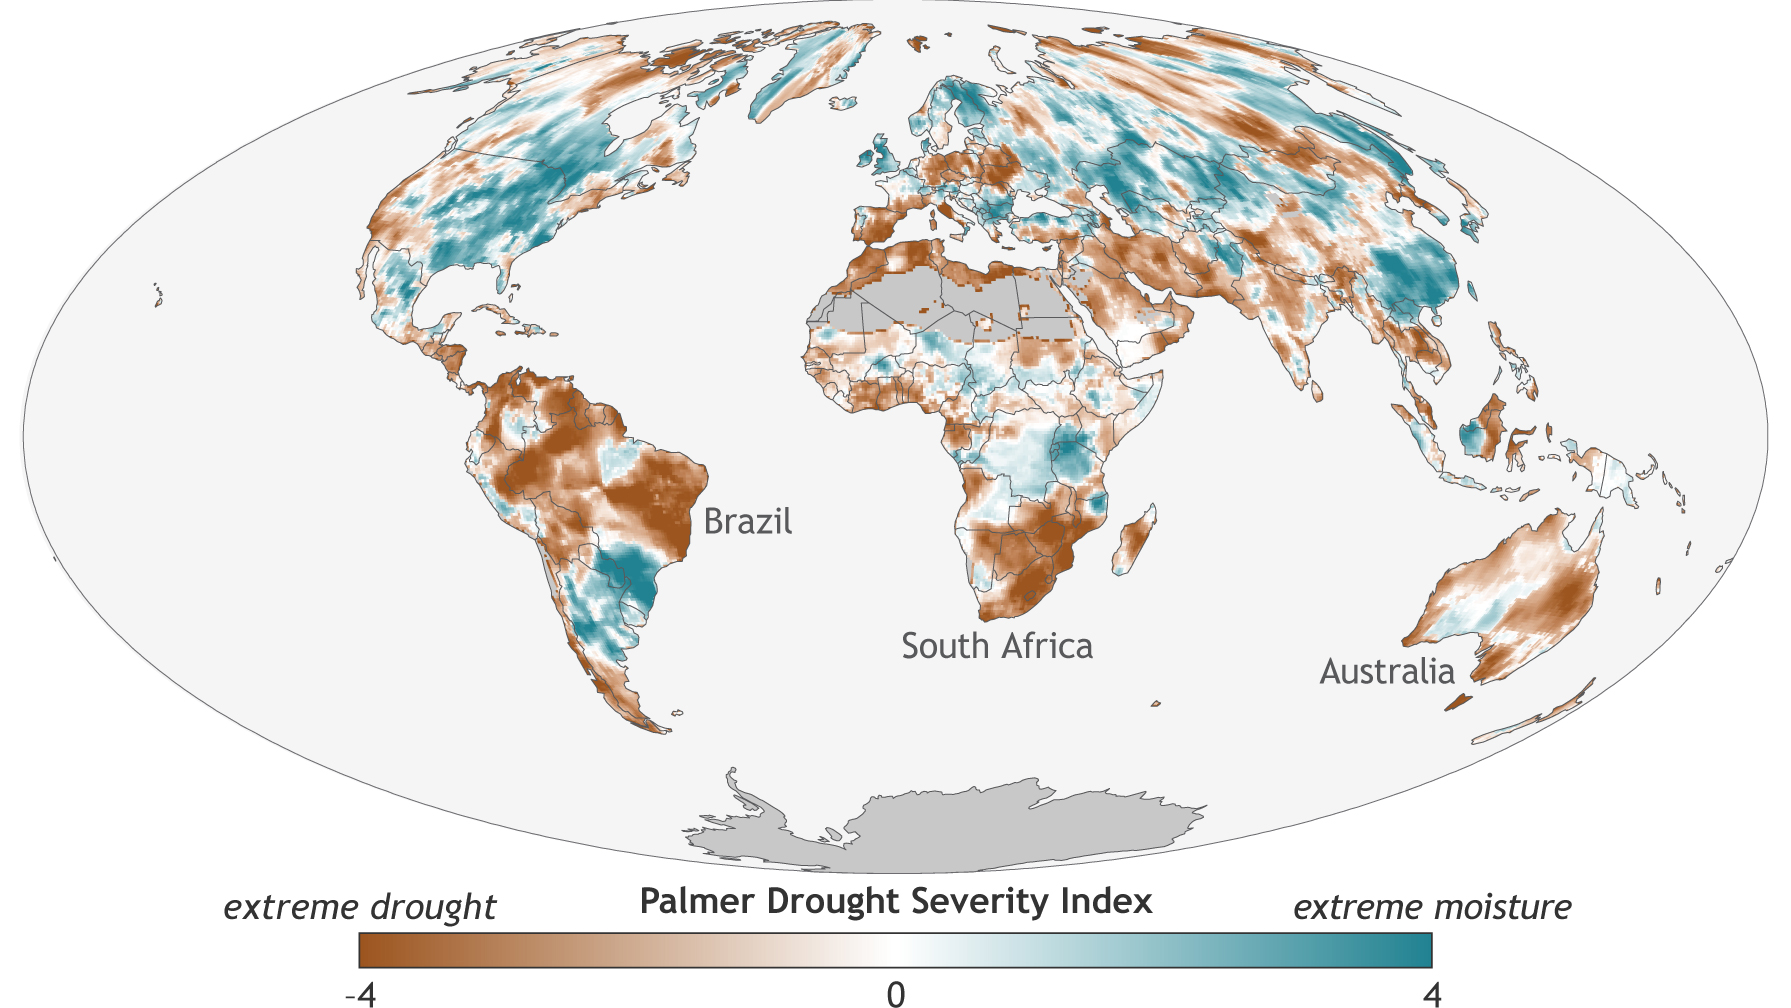
The pattern of extreme moisture and drought during 2016.
When it came to precipitation, 2016 brought noteworthy extremes at both ends of the spectrum, as the map above shows. Long-term, human-caused climate change along with El Niño led to both extreme flooding and drought during the year. According to NOAA’s summary of the 2016 report:
In addition to many parts of the globe experiencing major floods in 2016, for any given month at least 12 percent of global land was experiencing at least “severe” drought conditions, the longest such stretch in the record.
Here’s how human-caused warming is implicated:
It has amped up our planet’s hydrologic system by evaporating more moisture into the atmosphere. In some regions, this can dry soils, setting up conditions conducive to drought.
At the same time, increased evaporation provides more water vapor to condense into rain and snow. And in other regions, this can lead to more intense precipitation.
For broad swaths of the Northern Hemisphere, this process has indeed led to a well documented increase in precipitation since 1901, according to the Intergovernmental Panel on Climate Change.
As for the United States, the 2014 National Climate Assessment found “a clear national trend toward a greater amount of precipitation being concentrated in very heavy events.’
As a science journalist who has covered this issue since my first story in 1984, I find the evidence for human-caused climate change overwhelming and indisputable. And while I understand at an intellectual level why many people still deny this reality, it still boggles my mind.