Problematic Neuropeptides And Statistics (PNAS)
Author Vishay SinghPosted on Categories Discover Magazine
Back in May I discussed a paper published in PNAS which, I claimed, was using scientific terminology in a sloppy way. The authors, Pearce et al., used the word “neuropeptides” to refer to six molecules, but three of them weren’t neuropeptides at all. The authors acknowledged this minor error and issued a correction.
Now, it emerges that there may be more serious problems with the PNAS paper. In a letter published last week, researchers Patrick Jern and colleagues say that the statistics used by Pearce et al. were flawed.
Here’s what Pearce et al. did: a sample of 757 people were tested for 33 single-nucleotide polymorphisms (SNPs) spanning 9 genes involved in 6 different neurotransmitter systems. The participants were also tested on 8 measures of social and emotional behaviour.
The relationship between each SNP and each behavioural measure was assessed, for a total of 33 x 8 = 264 gene-behaviour pairs, but each was assessed using a number of genetic models (e.g. additive, dominant) for a grand total of 936 statistical tests.
Of these tests, 44 (4.7%) were statistically significant at the p<0.05 level, and Jern et al. point out that we’d expect a 5% positive rate by chance. Jern et al. go on to note that Pearce et al. did not clarify how many of the results survived multiple comparison correction:
Pearce et al. allude to having corrected for multiple testing using the mperm option in Plink. However, they do not report corrected P values, but instead report in the SI Appendix that ‘genotypic model significance levels did not always survive correction for multiple tests using mperm.’ It is unclear how many tests, if any, did survive multiple testing correction.
Pearce et al. argued in their paper that the pattern of significant gene-behaviour associations was significantly non-random, even if the individual results might not survive multiple comparison correction. Senior author Robin Dunbar made the same point in his response to Jern et al. The pattern of significant associations appeared in Pearce et al.’s Figure 2:
 Pearce et al. said of this table that
We can treat the data in Fig. 2 as a straightforward contingency table, with a P value of 0.05 as a convenient criterion for inclusion. These data are not subject to multiple comparisons effects because the P value is simply a criterion for a binary partition of the dataset. The distribution of significant effects shown in Fig. 2 is highly nonrandom (χ2 = 51.7, df = 10, P < 0.0001), with disproportionately higher frequencies than expected for endorphins, oxytocin, and dopamine.
I think this analysis is badly flawed. First off, I can’t see how the Fig. 2 data give a chi-squared (χ2) statistic of 51.7, p<0.0001. As far as I can see, the statistics are a less impressive χ2 = 20.4, p=0.013. Also, as Jern et al. point out, there are some discrepencies between Fig. 2 and the raw data, but these don’t change the statistics much.
The numbers don’t really matter, however, because the χ2 test is invalid. The main problem is that the observations (i.e. significant SNP-behavior associations) are not independent.
Suppose that we observe a significant association between, say, an oxytocin SNP and a dyadic relationships measure. And say we observe a second association between a different oxytocin SNP and the same measure. This makes two observations to go into the same cell of Fig. 2, but they’re not independent observations, if the two oxytocin SNPs are correlated with each other.
SNPs being correlated with other SNPs is called linkage disequilibrium (LD), and the oxytocin SNPs in this dataset show extensive LD, as I found from an analysis of Pearce et al.’s raw data.
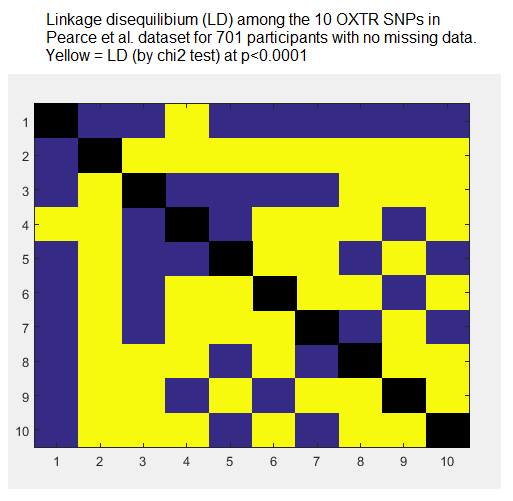
The LD problem alone makes Pearce et al.’s χ2 analysis flawed, because χ2 assumes independence of observations. There are also significant correlations among the eight different behavioural tasks, which makes matters worse.
Pearce et al. in fact alluded to the LD in the original paper, saying that it helped justify the decision to report uncorrected p-values:
Although genotypic model significance levels did not always survive correction for multiple tests using mperm, the consensus is that these corrections are likely to be overly conservative because they fail to account for dependence between tests due to linkage disequilibrium.
What’s sauce for the goose is sauce for the gander, and if LD makes mperm invalid, it certainly does so for χ2.
Finally, to rub salt into the wound, Jern et al. conclude their letter by saying they failed to replicate many of Pearce et al.’s findings:
We had available a sample (3) more than four times the size of Pearce et al.’s that enabled testing for replication of eight of the reported significant SNP associations with the Sociosexual Orientation Inventory (the variable with the most reported associations in their data). None of the associations were significant in our data.
Dunbar in his reply says that:
We have two smaller independent follow-up samples (currently under review) that show the same pattern. Our results are statistically robust.
In my view, the results are anything but robust. This is a seriously flawed paper, and the results seem to me consistent with chance alone.