Despite an unusually chilly Arctic, and El Niño's absence, July 2017 tied for warmest such month on record
Author Vishay SinghPosted on Categories Discover Magazine
That makes last month one of the warmest our planet has experienced since record-keeping began in 1880
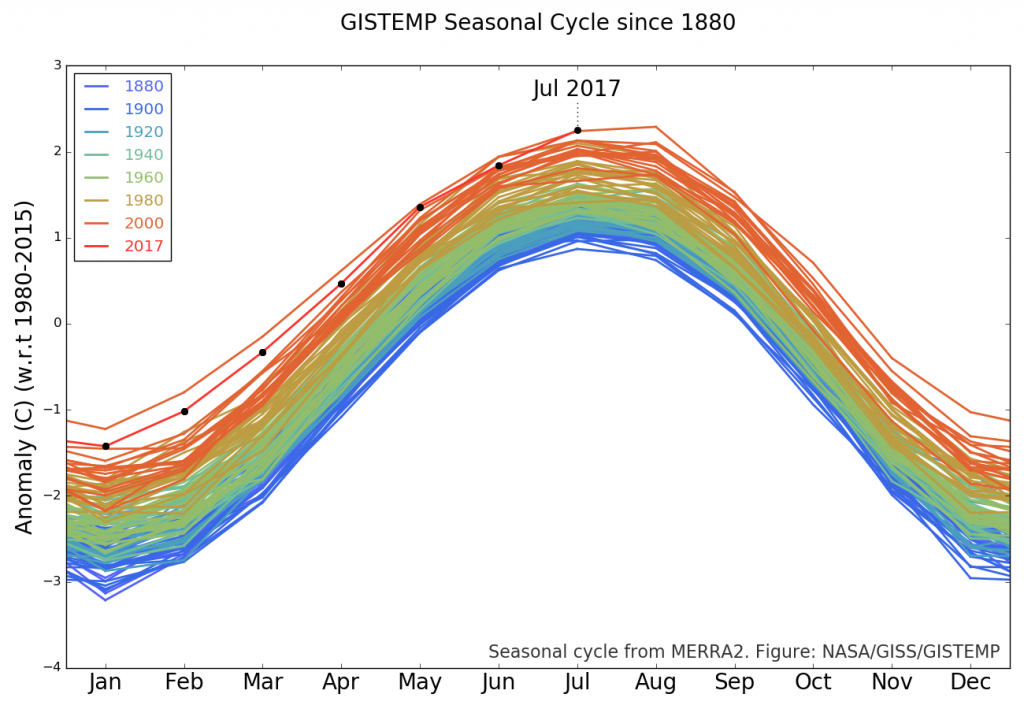
This graph shows how each month since 1880 has varied from the annual mean for the entire globe. The curve shows the seasonal cycle, with the warmest temperatures occurring during summer in the Northern Hemisphere. July 2017 tied with July 2016 for the second warmest such month on record — and was one of the warmest months in the record overall. (Source: NASA GISS)
Up in the high north, it was unusually cool last month. And unlike last year, there was no El Niño to help amp up temperatures for the globe overall.
Yet July 2017 was in a statistical tie for warmest such month in 137 months of record keeping, according to the monthly climate, according to a monthly analysis of global temperatures by scientists at NASA’s Goddard Institute for Space Studies.
July 2017 was 0.83 degrees Celsius warmer than the mean July temperature for the 1951-1980 period. Only July 2016 showed a similarly high temperature — 0.82 °C. All previous July’s were more than a tenth of a degree cooler, according to NASA.
The graph above allows us to visualize not only how July 2017 stacked up to previous July’s but also all other months. It shows how each month since 1880 has varied from the annual mean for the entire globe.
The result is a visualization of the seasonal cycle, with summer in the Northern Hemisphere naturally being the warmest months (for a reason I’ll get to in a minute). As the graph shows, July 2017 and July 2016 were second only to August of last year as being the very warmest of all 137 months in the record.
Why is summer in the Northern Hemisphere naturally warmer than summer in the south? There’s much more land compared to ocean in the north. And land absorbs and releases heat much more quickly than water. So the greater amount of water in the south tends to tamp down wide, seasonal temperature swings, at least when looking at the hemisphere as a whole.
July’s anomalous heat is quite surprising for a couple of reasons. The first is seen in this animation of two global maps:
Source: NASA GISS
The two maps in the animation show how temperatures have compared to the long-term mean during two different periods. In one map, I’ve shown how things looked last month. Note the blue temperatures in the Arctic, indicating that temperatures up north were mostly cooler than normal in July 2017. Meanwhile, in most other regions, anomalous warmth was the norm.
The second map shows how the globes temperatures varied from the long term mean on an annual basis from 2012 through 2016. I chose this five-year period to smooth out month-to-month variations and show a longer-term pattern. Note the reds up north, indicating that over that longer-term period, the Arctic has been considerably warmer than any other region.
In fact, over the long term, the Arctic has been warming twice as fast as the rest of the globe.
The Arctic chill should have helped temper the overall global picture in July. But quite surprisingly, it did not.
And then there’s the other surprising factor. During July of last year, global temperatures received a significant boost from El Niño. But El Niño and its after-effects are now long gone. Yet even without a boost, last month still managed to tie with July of 2016.
This is clearly a testament to the continuing impact of human-caused warming on our planet.
Where might 2017 as a whole wind up?
Prediction for 2017 annual mean in GISTEMP w/Jul data in, 77% chance of a top 2 year. pic.twitter.com/zwZVnEXit3
— Gavin Schmidt (@ClimateOfGavin) August 15, 2017
The Tweet above shows the prediction from Gavin Schmidt, who heads NASA’s Goddard Institute for Space Studies. Based on 2017’s data through July, it’s quite likely that this year will go down in the record books as second only to 2016 as warmest on record.