State-of-the-art NOAA-20 satellite is operational, promising better weather forecasts
Posted on Categories Discover Magazine
Check out this imagery from the next generation, polar-orbiting NOAA-20 spacecraft, which also heralds improved environmental monitoring
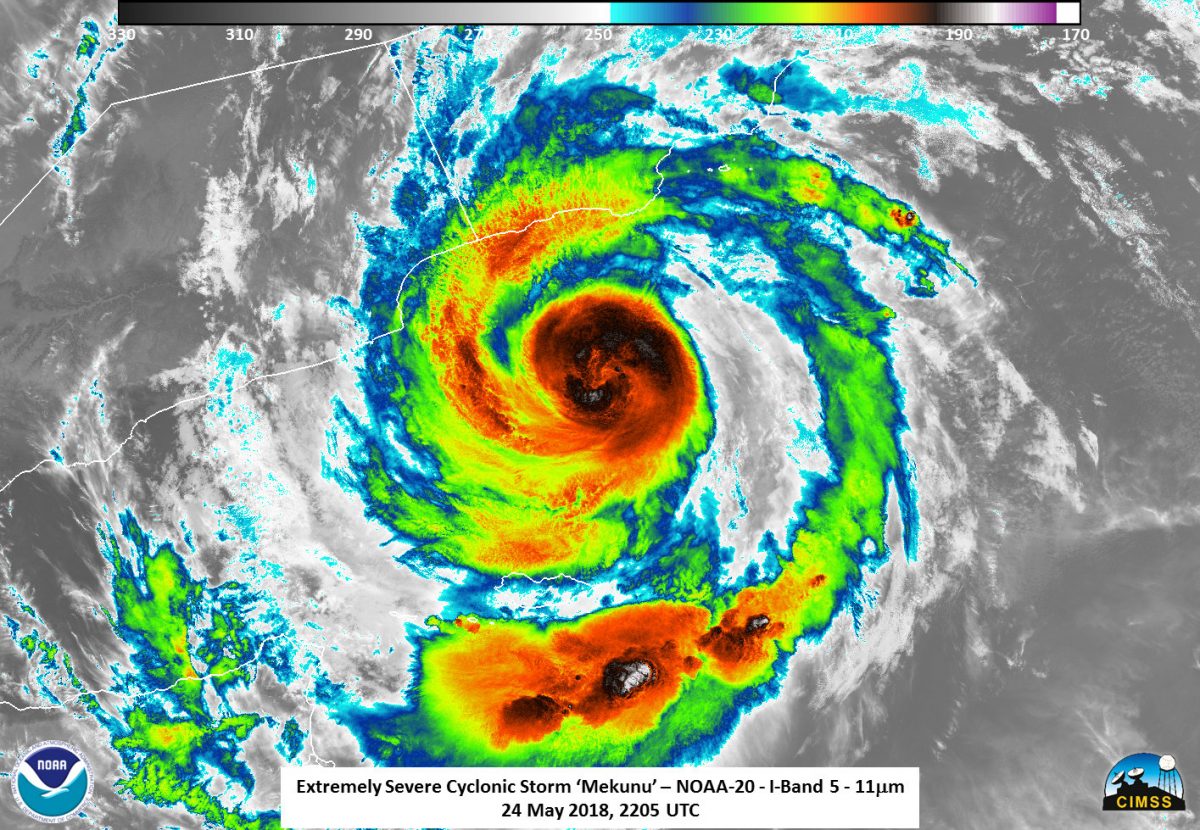
The NOAA-20 satellite captured this infrared image of Tropical Cyclone Mekunu on May 25 as it was approaching Yemen and Oman. (Source: NOAA/UWM/SSEC/CIMSS, William Straka)
A constellation of satellites that monitor the vital signs of our planet just got a new, official member: the next-generation NOAA-20 satellite. It was declared fully operational yesterday after undergoing months of rigorous testing.
Launched last November as part of NOAA’s Joint Polar Satellite System, NOAA-20 is designed to observe Earth’s atmosphere, land and waters with greater precision than any of NOAA’s previous polar-orbiting satellites.
Regular readers of ImaGeo might recognize the names of some of these satellites — Terra, Aqua, Suomi-NPP — because I regularly use imagery from them here. As an unabashed remote sensing geek, I’m thrilled to see what NOAA-20 will add to what these spacecraft have already been providing.
The image above, as well as more to follow below, offers a taste of what’s to come. It’s an infrared image of powerful Tropical Cyclone Mekunu on May 25 as it was about to slam into Oman and Yemen on the Arabian Peninsula with winds equivalent to a Category 3 hurricane.
The image shows data on the temperature of the cloud tops, with darker colors indicating colder temperatures. Changes in cloud-top temperatures can help forecasters determine whether a storm is strengthening or weakening.
When the temperatures get colder and colder it means that the clouds in a storm are blossoming higher and higher into the atmosphere. This happens as thunderstorms — in this case within the cyclone — grow and get more powerful, indicating a strengthening of the storm. Conversely, when cloud-top temperatures drop, it’s an indication that the storm is weakening.
NOAA-20’s data on Mekunu showed that the cloud tops at the center of the cyclone, and in a band to the south, were colder than minus 99.6 degrees Fahrenheit!
As it turned out, Mekunu’s landfall in Oman was the strongest on record there. Three years’ worth of rain fell on Oman in just 24 hours, causing severe flooding. Unfortunately, more than a dozen people were killed.
Better cyclone forecasts made possible by NOAA-20 and satellites to come could help prevent many injuries and deaths by giving people on the ground better warning of what’s coming, and where and when it might hit.
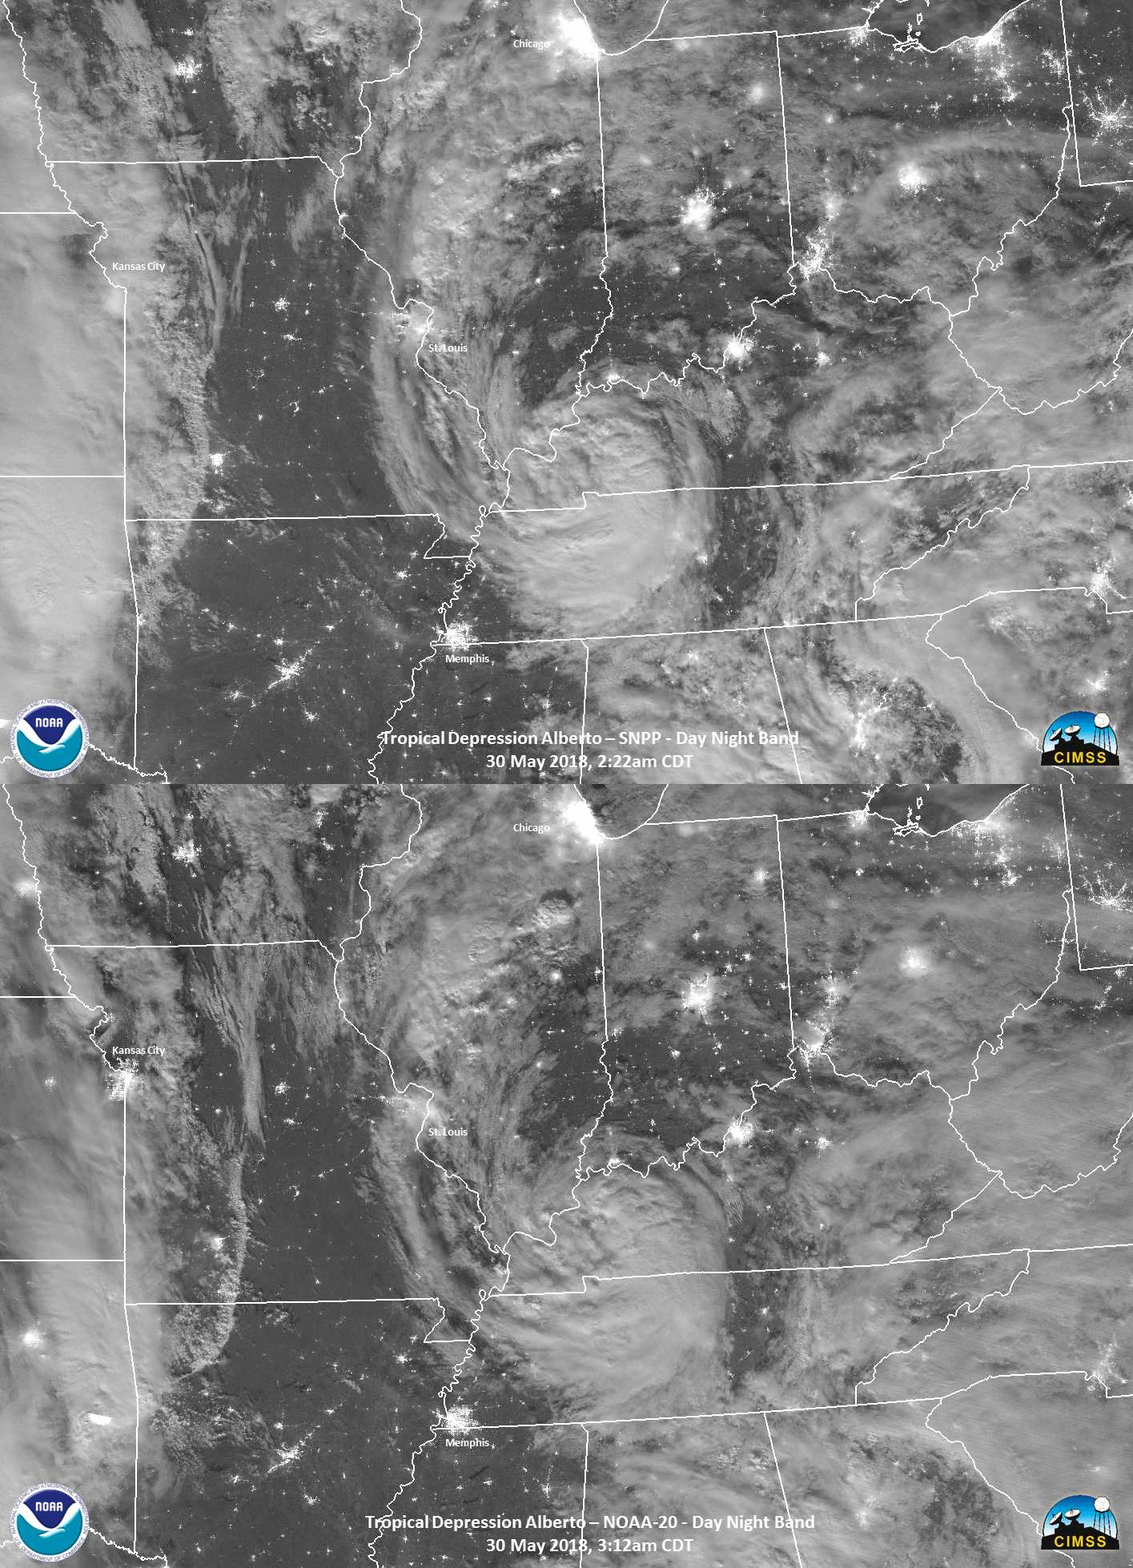
An animation of Suomi-NPP and NOAA-20 images shows tropical depression Alberto on the night of May 30, 2018. (Source: CIMSS Satellite Blog/Will Straka)
NOAA-20, along with its predecessor Suomi-NPP, just overflew another storm, tropical depression Alberto, returning compelling imagery. It happened on May 30, 2018 — the day that the spacecraft was declared officially operational. A near-full moon provided ample illumination, as you can see in the animated GIF above.
The first image is from Suomi-NPP. The second is from NOAA-2o, which flies around the poles one-half orbit behind Suomi-NPP. That explains the northeast movement of the storm in the animation.
Thunderstorms developed far to the north of Alberto. Look for them just south of Chicago. Also look to the extreme left of the animation. In the second image, from NOAA-20, you can make out a streak of lightning occurring over Oklahoma.
Speaking of the polar orbits of Suomi NPP and NOAA-20, this portion of a video produced by NOAA shows how the two spacecraft cover the planet every day, with each one making 14 orbits in a 24-hour period. (You’ll note an icon popping up toward the beginning indicating that I turned off the sound when I did a screen recording of this part of the video. Whoops! 😉 )
Suomi NPP was a joint NOAA-NASA demonstration satellite launched in 2011. It has served as a pathfinder for NOAA-20. And a second polar satellite, JPSS-2, is being designed and built, with a launch scheduled for 2021.
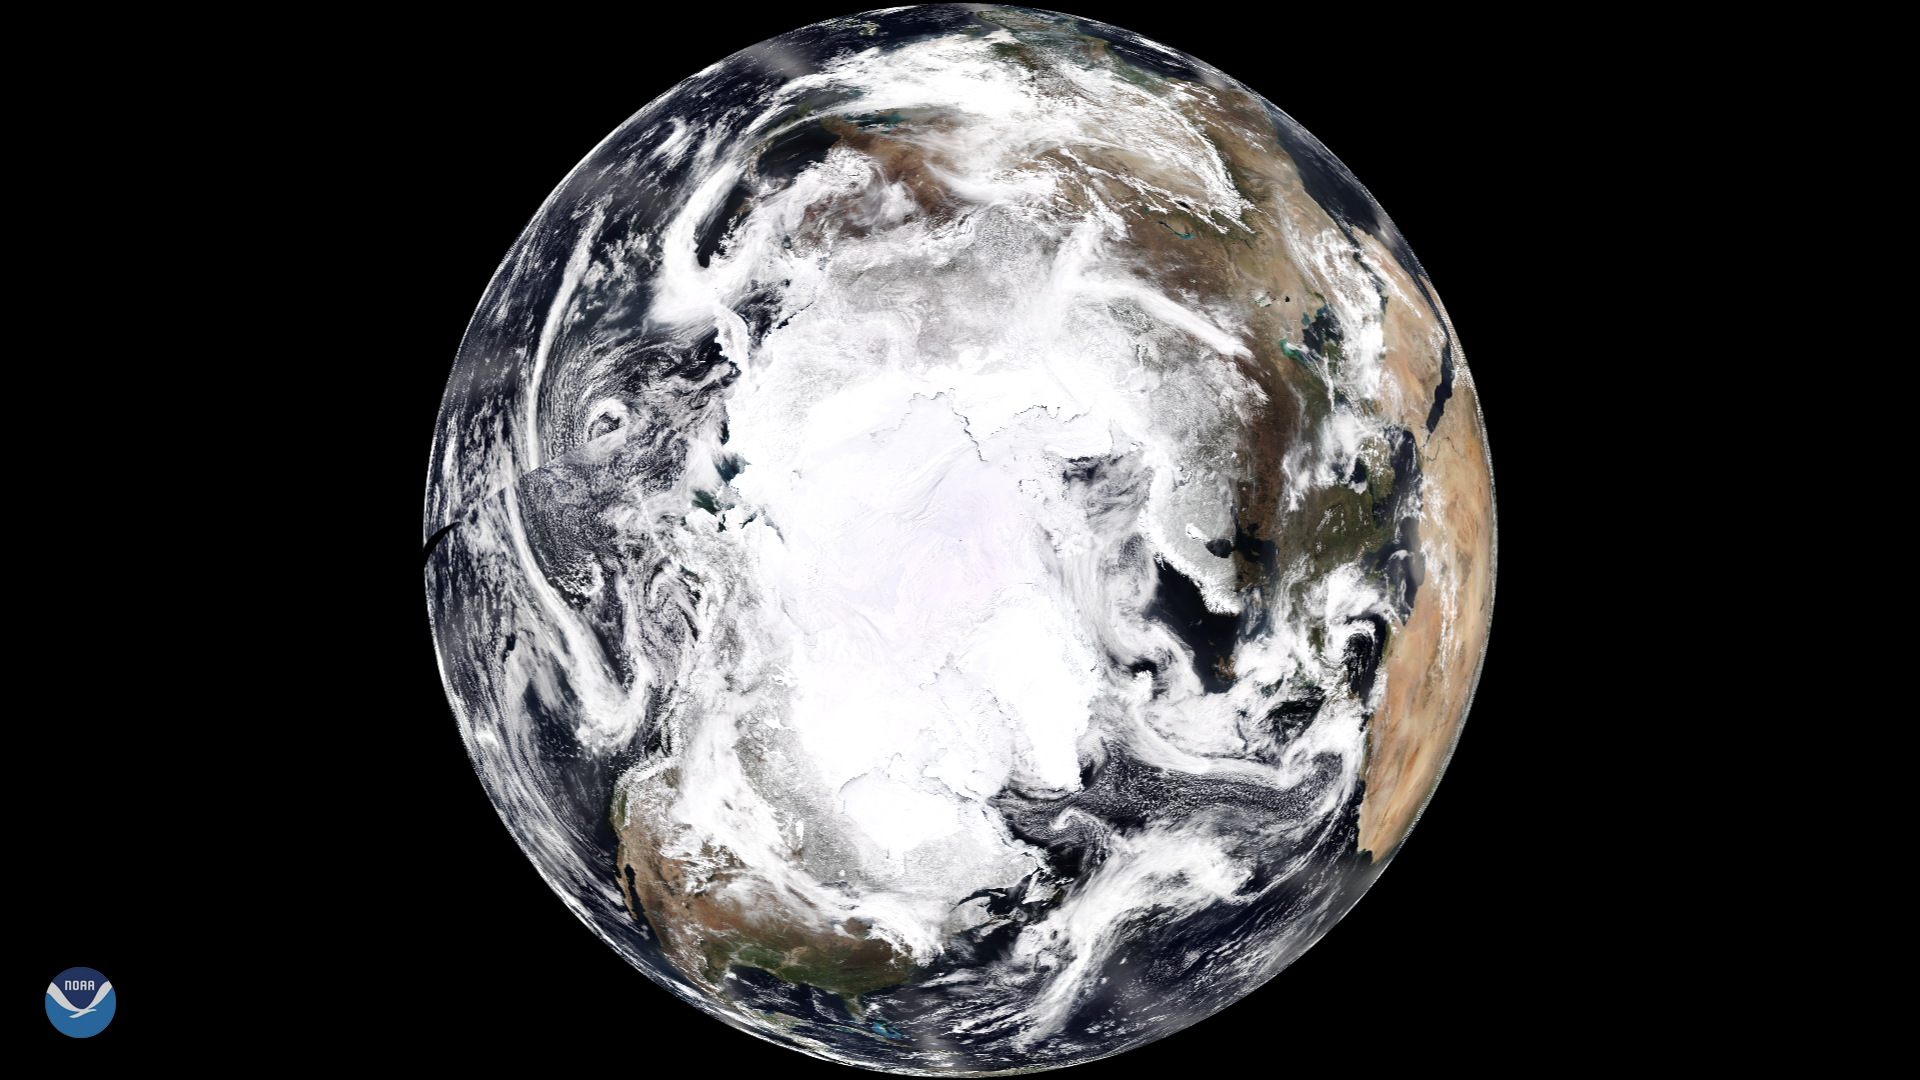
This image looking down on the Arctic was produced with data acquired by NOAA-20 during its 14 passes over the region on April 12, 2018.
Here’s a detailed explanation from NOAA:
The VIIRS instrument onboard the satellite created this synthesized view of Earth with the North Pole directly in the center of the image. If you look closely, you’ll see the outline of the North American continent and the Baja Peninsula on the left hand side. Scientists use the data from the VIIRS sensor to create the ‘true-color’ product you see here. Like a photograph, the satellite reads the appearance of clouds, land, vegetation and water to create these images.
This is the image we have of our planet as it would appear if we could take a single photograph of the entire Northern Hemisphere. The swath line shown on the left hand side represents the start and end of the 24-hour period taken by the satellite to create the image.
NOAA released this image in honor of Earth Day, which falls on April 22.
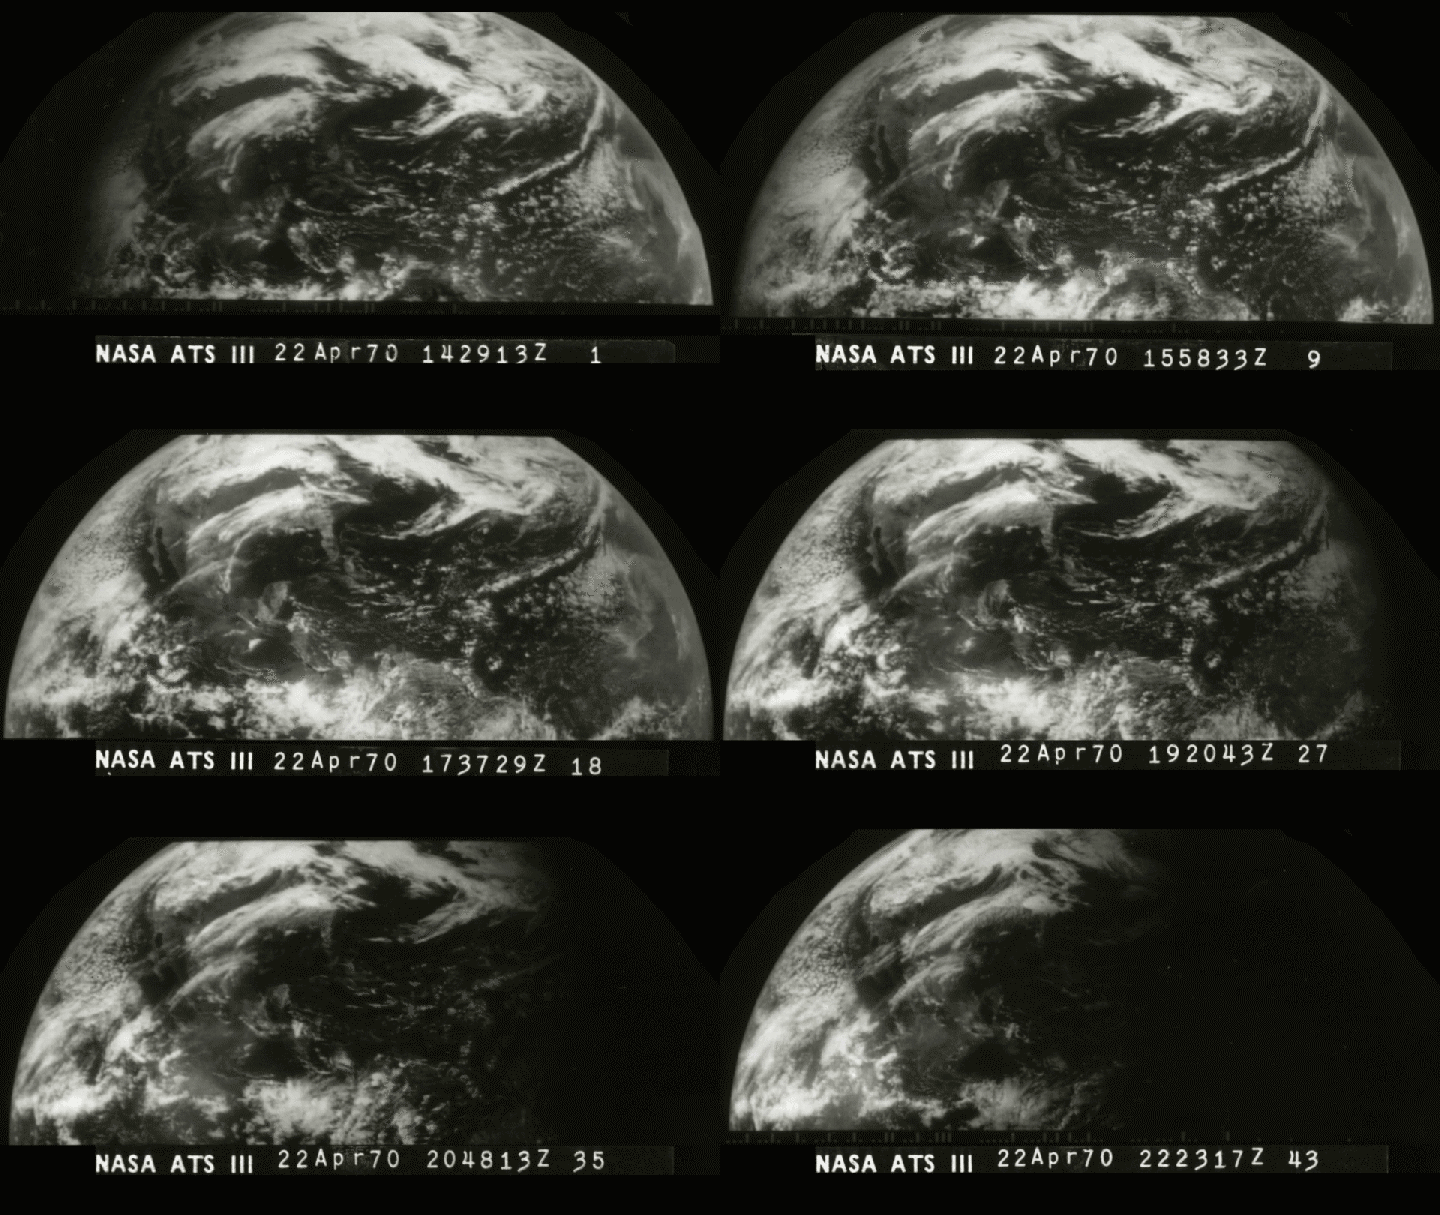
To get a sense of just how far we’ve come in remote-sensing satellite technology, check out the animation above. The imagery was acquired on the first Earth Day, April 22, 1970, by the Applications Technology Satellite-3, or ATS-3.
To be fair, this was not a polar-orbiting satellite like NOAA-20. Instead, it observed the Earth from a geostationary position about 22,300 miles above Earth, much farther away. (This is the same orbit of the GOES-East and West satellites.) But still, I think the comparison is pretty revealing.

An image acquired by the VIIRS instrument aboard NOAA-20 on January 17, 2018. (Source: VIIRS Imagery and Visualization Team Blog, RAMMB/CIRA)
I chose this NOAA-20 image to close out this post because it shows something very unusual. Click on it to enlarge it, and then look closely. Can you guess what I’m getting at?
At the bottom third of the image is the Gulf of Mexico, with coastal Texas to the left, Louisiana, Mississippi and Alabama more or less in the middle, and Florida to the right. See that white stuff on the ground, including a swath that reaches almost to the Gulf?
It’s snow!
A frigid Arctic airmass had plunged that far south, bringing record low temperatures — and snow. Pretty unusual in that region.
