Google Street View Cars Are Mapping Methane Leaks
Author Vishay SinghPosted on Categories Discover Magazine
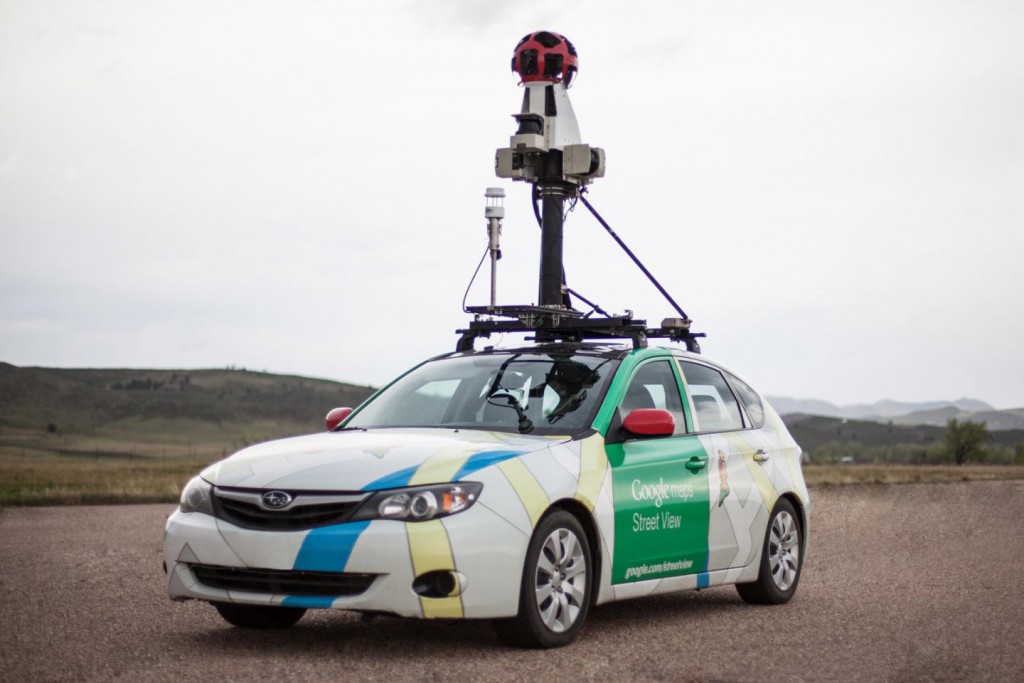
Some Google Street View cars have been specially equipped with methane analyzers to detect methane lakes from natural gas lines. (Credit: Environmental Defense Fund)
Natural gas pipeline leaks that pose a safety hazard are quickly addressed. But what about leaks too small to pose a threat? These mall leaks are often overlooked and they collectively release tons of methane, a greenhouse gas 84 times more potent than carbon dioxide.
However, thanks to researchers from Colorado State University, the University of Northern Colorado, and Conservation Science Partners—who’ve teamed up with the Environmental Defense Fund—a small unit of Google Street View cars are turning into mobile methane sensors to monitor leaks that have flown under the radar.
A Mobile Amalgamation For Methane Measurement
Lead researcher Joe von Fischer, a biologist by training, originally bought a laser spectrograph, which scans invisible gases that are opaque under infrared light, a decade ago to use on the Arctic tundra. That is, until he one day decided to put it in his car and drive around Fort Collins. He ended up finding a local methane leak with his mobile amalgam of a methane sensor.
“At the same time, Google was interested in putting some of these new methane analyzer analogs in their vehicles, and the Environmental Defense Fund was interested in methane because it’s so poorly quantified,” says von Fischer. Naturally he was put in charge of the project.
Since then, their collaboration has seen sensor-equipped Street View cars map methane leaks in pipelines beneath the roads of 14 cities throughout America, releasing the data publicly as citywide maps online. The initiative has even helped spur one New Jersey utility provider to commission a $905 million upgrade to gas lines.
In paper published Wednesday in Environmental Science and Technology the researchers revealed findings from their operations. Turns out, the project was more difficult that it appears on the surface.
“It sounds so straightforward right?” von Fischer asks. “You’re dealing with 2,000 data points per minute. You have GPS data. You have instrument quality data. You have methane concentration … 30 or 40 data fields are being generated at each time point, and there are two time points each second.”

Joe von Fischer and a methane sensor that’s used in the project. (Credit: Colorado State University)
Using algorithms to parse through what von Fischer called a “shitstorm” of data, they excluded measurements gathered at high speeds, because it could skew the data. High readings that extended farther than 160 meters were also nixed, as they were likely caused by interference from landfills or natural sources of methane.
A Pixelated Picture Of Methane Deposits
The researchers found that cities with older pipeline infrastructure, such as Boston, Staten Island and Syracuse, constructed with corrodible materials like cast iron or bare steel, leaked 25 times more methane—peaking at 2 liters of methane per minute per kilometer—than cities with gas line-modernizing Advanced Pipeline Replacement Programs (APRP).
Granted, their technique is no substitute for aerial methane measurements, nor meant to give absolute measurements of methane output. In fact, they note that the data collected by the cars was on the conservative side, and even with five passes, their sensors still had error bars that low-balled the methane measurements by 24 percent, or overestimated by 32. Still, analyzing the variation of background methane generates a pixelated view of where the leaks are coming from.
In cities where von Fischer notes that it’s more feasible to address methane leaks, better data could come with greater incentive to modernize gas lines and lower emissions.