TimeTree's New Look At Evolution — And It's Free!
Author Vishay SinghPosted on Categories Discover Magazine
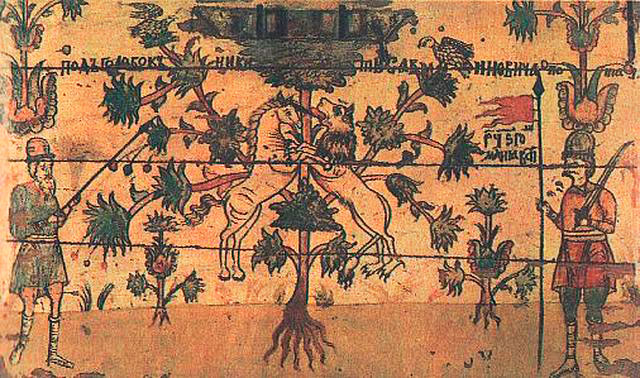
Depictions of the “tree of life” have come a long way — and changed in meaning — since this 17th century Russian take on it. (Credit Wikimedia Commons)
Who doesn’t love free stuff? I know I do. And a renovation of open access evolution database TimeTree is a treasure chest of data for the taking.
The idea of a tree of life has been an element across many cultures for millennia, but since the days of Darwin it’s become a handy way to visualize how species diverge from common ancestors over time.
TimeTree, a self-described “public knowledge-base” about the evolutionary timeline for life on Earth, has been around for seven years. It’s the product of Temple University researchers who wanted to gather nerdy data from thousands of studies using DNA and number-crunching calculations of the rate of speciation, then translate all that into a user-friendly way of looking at life on Earth and how it has evolved.
TimeTree has already incorporated data from more than 3,000 peer-reviewed, published studies; the team continues to add research to refine and expand the database — oops, excuse me, knowledge-base.
Today TT gets a makeover, adding new features to make it easier and faster for anyone to answer such burning questions as “when was the last common ancestor of my dog and a T. rex?”

Don’t let the illusion of bipedalism and tiny arms fool you. Not a T. rex.
Answer: an estimated 312 million years ago, based on 22 studies from the database with information relevant to the query. You can view the studies’ citations and download them for later use. You can also download a .jpg file that shows you from eon to age the chronological focus of the different studies used to estimate time of divergence (the gray-black dots below).
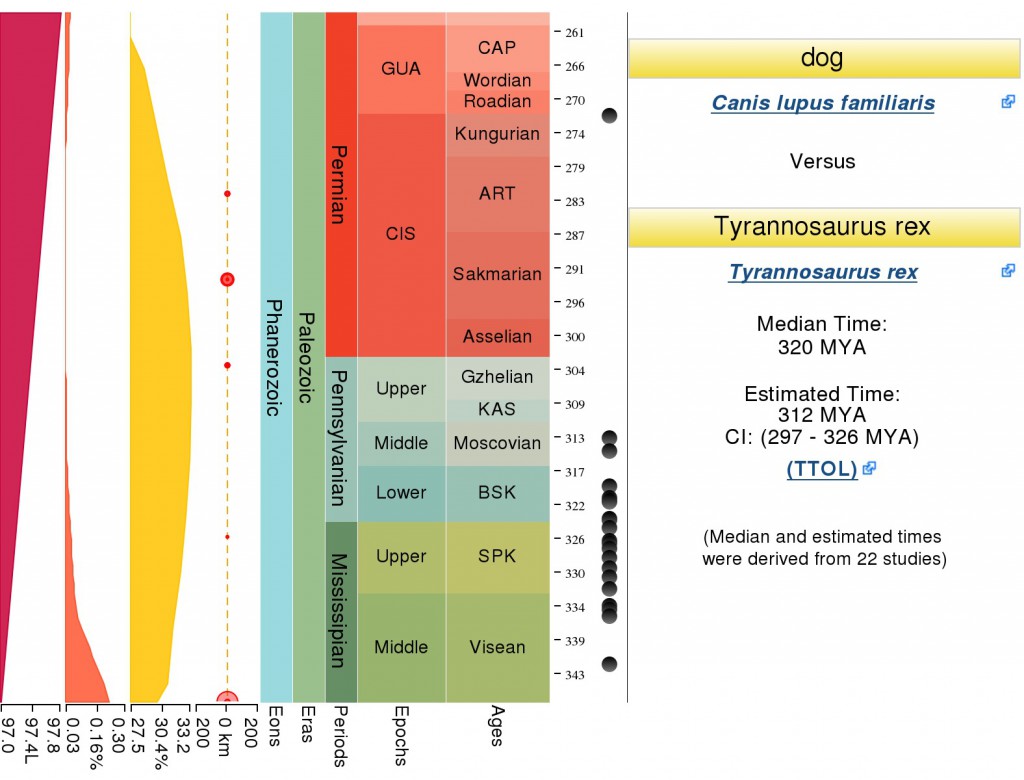
(Credit TimeTree and too much time on my hands)
That’s just for starters. Your custom TT chart includes a lot of other information. From left to right on the image above, you’ve got level of solar intensity (red), carbon dioxide levels (orange), oxygen levels (yellow) and my personal favorite, the estimated time and size of major space rock impacts.
But Wait, There’s More…
The niftiest new features include the ability to build a customizable tree of a group of species and also create a timeline of a single genus or species.
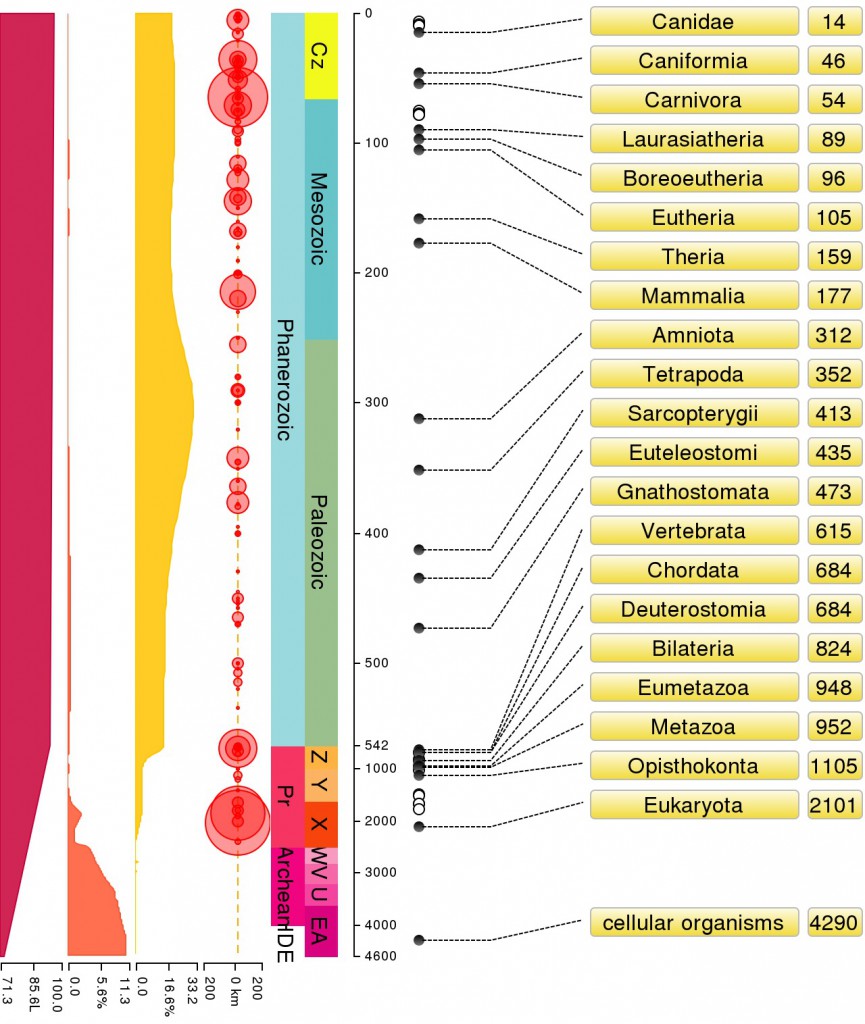
The timeline for the evolution of the genus Canis, which includes my dogs and yours as well as wolves, jackals, coyotes and such. (Credit TimeTree)
Try it out for yourself…what do you have to lose, other than all the time you’re going to spend playing around with it.
(By the way, if you’re not up on your geologic time abbreviations, get thee to the International Commission on Stratigraphy’s page for downloading its frequently updated chronostratigraphic chart. You’re welcome.)