The Misuse of Meta-Analysis?
Author Vishay SinghPosted on Categories Discover Magazine
Over at Data Colada, Uri Simonsohn argues that The Funnel Plot is Invalid.
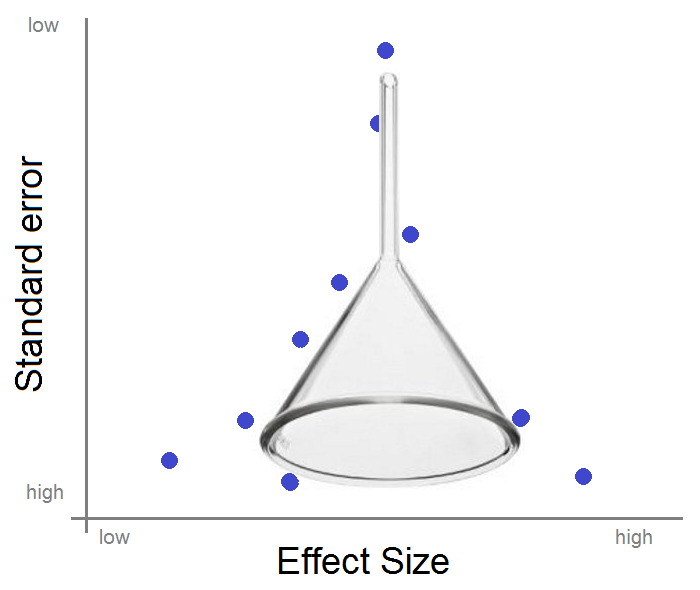
Funnel plots are a form of scatter diagram which are widely used to visualize possible publication bias in the context of a meta-analysis. In a funnel plot, each data point represents one of the studies in the meta-analysis. The x-axis shows the effect size reported by the study, while the y-axis represents the standard error of the effect size, which is usually inversely related to the sample size.
In theory, the points should form a triangular “funnel” pointing upwards, if there is no publication bias. If the funnel is asymmetric, this is taken as evidence of publication bias. Typically, we say that an asymmetric plot indicates that small studies that find a large effect are being published, while other small studies, that happen to find no effect, remain in the proverbial file drawer.
However, Simonsohn points out that we can only infer publication bias from a funnel plot if we assume that there is no “real” correlation between the effect size and the sample size of the included studies. This assumption, he says, is probably false, because researchers might choose larger samples to study effects that they predict to be smaller:
The assumption is false if researchers use larger samples to investigate effects that are harder to detect, for example, if they increase sample size when they switch from measuring an easier-to-influence attitude to a more difficult-to-influence behavior. It is also false if researchers simply adjust sample size of future studies based on how compelling the results were in past studies… Bottom line. Stop using funnel plots to diagnose publication bias.
In my view, Simonsohn is right about this “crazy assumption” behind funnel plots – but the problem goes deeper.
Simonsohn’s argument applies whenever the various different studies in a meta-analysis are studying different phenomena, or at least measuring the same phenomenon in different ways. It’s this variety of effects that could give rise to a variety of predicted effect sizes. Simonsohn uses this meta-analysis about the “bilingual advantage” in cognition as an example, noting that it “includes quite different studies; some studied how well young adults play Simon, others at what age people got Alzheimer’s.”
Simonsohn’s conclusion is that we shouldn’t do a funnel plot with a meta-analysis like this, but I wonder if we should be doing a meta-analysis like this in the first place?
Is meta-analysis an appropriate tool for synthesizing evidence from methodologically diverse studies? Can we really compare apples and oranges and throw them all into the same statistical juicer?
The “comparing apples and oranges” debate around meta-analysis is an old one, but I think that researchers today often gloss over this issue.
For instance, in psychology and neuroscience there seems to be a culture of “thematic meta-analysis” – i.e. a meta-analysis is used to “sum up” all of the often diverse research addressing a particular theme. I’m not sure that meta-analysis is the best tool for this. In many cases, it would make more sense to just rely on a narrative review, that is, to just write about the various studies.
We also see the phenomenon of “meta-analytic warfare” – one side in a controversy will produce a meta-analysis of the evidence, and then their opponents will reply with a different one, and so on back and forth. These wars can go on for years, as the two sides accuse each other of wrongly including or excluding certain studies. My concern is that the question of which studies to include has no right answer in the case of a “theme” meta-analysis, because a theme is a vague concept not a clearly-defined grouping.