Spectacular new satellite imagery of severe storms shows the atmosphere as a boiling, roiling cauldron of clouds
Author Vishay SinghPosted on Categories Discover Magazine
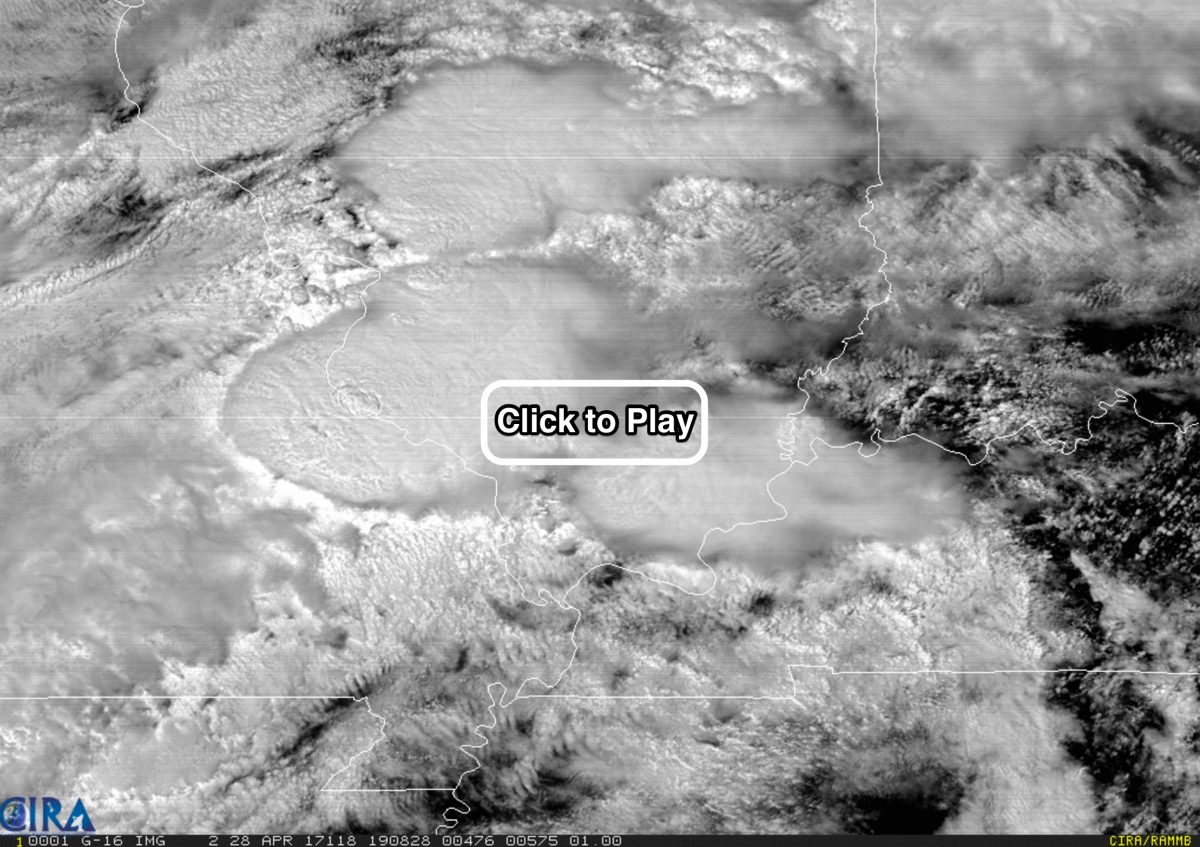
High-resolution animation from GOES-16: massive thunderstorms over southern Illinois, part of a sprawling, dangerous weather system
A screenshot from an animation of GOES-16 weather satellite images shows severe storms boiling up over southern Illinois, where they dumped heavy rainfall on April 28, 2017. Click to watch the animation. (Source: CIRA/RAMMB/NOAA)
A large swath of the nation’s midsection has been hammered with torrential downpours. And the forecast calls for yet more, thanks to a low-pressure system pumping super-moist air into the region. With the ground already saturated, the sustained heavy rainfall is threatening major flooding from Oklahoma and Arkansas and up into Missouri, Illinois and Indiana.
On Friday, April 28th, the new GOES-16 weather satellite captured just how roiled up the the atmosphere was on that day over, centered over southern Illinois. The spectacular animation shows what it looked like as severe storms boiled up over the region. The images that make up the animation were acquired by the satellite in intervals of 30 seconds, allowing for a near-real-time view of the developing storms.
The momentum of the updrafts in the cores of the thunderstorms were so strong that rising air parcels punched up above the anvils that typically form the tops of these storms. You can see this happening in the animation as dome-like protrusions blossom from the big thunderstorm cells. The phenomenon is known as ‘over-shooting’ tops. And sometimes, the overshoot can thrust from the lower level of the atmosphere, the troposphere, right on up into the stratosphere above.
But the boiling action does not stop there. In the animation, look for evidence of air parcels rising up in the storm, subsiding, rising up, and settling again. To my eye, this looks like the roiling action of a thick, cooking stew.
The repeated rising and falling of air parcels also causes another fascinating phenomenon visible in the high-resolution animation: a wave phenomenon in the clouds. Look very carefully and you might see ripples in the cloud tops — something akin to what happens when a stone is tossed into a pond. These features are called ‘gravity waves.’
The persistent severe weather had its origins in a low pressure system in the south, with a high pressure system off the east coast. Here’s what that juxtaposition looks like in a forecast spanning the period between Friday, April 28th and Monday, May 1:
You can easily see by animation how efficient this pattern is at maximizing moisture transport with a strong high off the southeast coast. pic.twitter.com/b1QO8nCh2k
— Taylor Trogdon (@TTrogdon) April 28, 2017
The colors show precipitable water in the atmosphere, which is basically how much water would fall as rain if all the moisture over a particular spot condensed and fell to the ground. In the animation, you can see the low pressure system spinning counterclockwise, and the high clockwise. In between the two, this action sucks huge amounts of moisture up from the Gulf of Mexico and, like a fire hose, aims it up through the South and Midwest.
Today’s forecast map shows that this set-up is indeed continuing:
The forecast for Sunday, April 30, issued at 4:51 EDT by NOAA’s Weather Prediction Center
That big, red “L” is the low pressure system. The yellow hatched area shows where severe thunderstorms are possible, thanks to all that water being sucked up north from the Gulf. The red hatched area indicates where flash flooding is possible.
On the left side of the low, circulation is sweeping cold air down from the north. So here, heavy snow, not rain, is possible.
How much precipitation is coming out of this persistent pattern? Here’s the prediction issued a few days ago for how much would fall between April 28th and May 1:
Source: NOAA Weather Prediction Center
Check out that angry splotch of orange and red! The highest amounts were forecast within it. A part of Arkansas near the border with Oklahoma and Missouri was forecast to get as much as 7.83 inches.
Lastly, a note about the GOES-16 satellite that produced the spectacular animation. It provides greatly enhanced geographic and temporal detail that promises improvements in weather forecasting. In previous posts (here and here), I started a new series showcasing the dazzling imagery from GOES-16 (which is still on its shakedown cruise and thus not technically operational). This post is the third in that series.